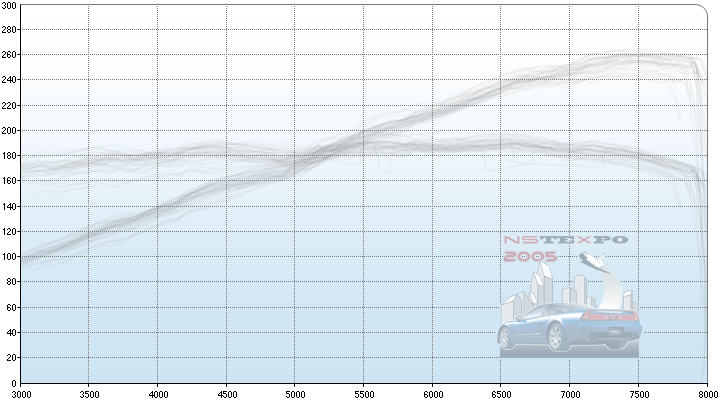
Each dyno run from the NSteXpo 2005 Dyno Session is shown in the table to the right. The emphasized rows indicate the strongest runs for each vehicle. Click a run to view its graph. Click it again to remove it. Upto three runs may be viewed at a time.
Horizontal axis is engine RPM. Vertical axis is power (in SAE horsepower) and torque (in foot-pounds).
| owner | run | power | torque | time | |
| NSXLuvr | |||||
| 1 | 254.33 | 196.19 | 10:32:30 | ||
| 2 | 259.36 | 198.97 | 10:33:44 | ||
| 3 | 259.05 | 197.52 | 10:34:44 | ||
| Fastrunner | |||||
| 1 | 254.89 | 189.11 | 10:57:56 | ||
| 2 | 255.07 | 189.80 | 11:01:30 | ||
| 3 | 260.13 | 191.94 | 11:02:26 | ||
| rbirling1 | stock cats |
||||
| 1 | 254.10 | 190.55 | 11:19:48 | ||
| 2 | 252.07 | 189.49 | 11:22:02 | ||
| Random Tech. cats |
|||||
| 3 | 253.94 | 189.45 | 14:01:02 | ||
| 4 | 256.72 | 193.20 | 14:02:02 | ||
| 5 | 259.29 | 194.22 | 14:02:50 | ||
| SamBel | |||||
| 1 | 245.21 | 190.69 | 11:42:38 | ||
| 2 | 248.48 | 191.74 | 11:43:54 | ||
| 3 | 247.42 | 190.98 | 11:45:10 | ||
| loNfastNSX | |||||
| 1 | 250.28 | 185.04 | 12:07:14 | ||
| 2 | 253.00 | 189.27 | 12:08:42 | ||
| 3 | 255.54 | 188.78 | 12:09:34 | ||
| NSX FoYoAss | |||||
| 1 | 241.73 | 185.79 | 12:33:40 | ||
| 2 | 243.81 | 186.80 | 12:34:32 | ||
| 3 | 244.16 | 186.88 | 12:35:20 | ||
| DPG | |||||
| 1 | 260.82 | 192.08 | 12:58:58 | ||
| 2 | 260.95 | 191.18 | 13:00:00 | ||
| 3 | 260.29 | 189.63 | 13:01:14 | ||
| mmmvious | |||||
| 1 | 259.70 | 195.43 | 13:19:20 | ||
| 2 | 263.62 | 197.14 | 13:20:30 | ||
| 3 | 263.68 | 196.66 | 13:21:48 | ||
| Paul | |||||
| 1 | 257.06 | 188.48 | 13:41:22 | ||
| 2 | 260.77 | 188.90 | 13:42:18 | ||
| 3 | 264.83 | 193.44 | 13:43:26 | ||
| clear graph | |||||